-
Lavinia Baumstark authoredLavinia Baumstark authored

- Analyzing REMIND model outputs
- 2.1. Generation of summary and validation pdfs
- 2.2 A Summary of Results
- 2.3 The Whole Range of Validation
- 3.1. AppResults
- 4.1. Execution of model-internal output scripts via the REMIND configuration file
- 4.2. Execution of model-internal output scripts in the command window
Analyzing REMIND model outputs
Felix Scheyer (felix.schreyeru@pik-potsdam.de), Isabelle Weindl (weindl@pik-potsdam.de), Lavinia Baumstark (baumstark@pik-potsdam.de)
- 1. Introduction
- 2. Automated model validation
- 3. Interactive scenario analysis
- 4. Model-internal R-scripts for output analysis
- 5. Analysis of outputs with the magpie4 library
- 6. Analysis of outputs with the quitte library
- 7. Analysis of outputs with the gdx library
- Introduction =================
After having successfully started and accomplished a simulation run, the next step is to evaluate the simulation results.
There are several ways to assess and evaluate REMIND results. This tutorial gives an overview on different tools and options that can be used to analyse model outputs.
For each simulation, results are written to a folder that is created automatically as a combination of model title name and the current date inside the output folder of the model.
- Automated model validation ===============================
2.1. Generation of summary and validation pdfs
The automated model analysis (summary and validation) is an important example of output analysis based on model-internal scripts (see section 4). If these scripts are executed (either by selection via cfg$output as explained in 4.1. or by execution via command window as explained in 4.2.), standard evaluation pdfs are created. They validate numerous model outputs with historical data, either visually or via statistical tests.
2.2 A Summary of Results
For a first overview and for not getting lost in the huge amount of variables you can look at the REMIND_summary_[title].pdf. This .pdf-file will give you an overview on the model results and guides you through the story.
2.3 The Whole Range of Validation
A standard validation PDF REMIND_validation_[title].pdf consists of hundreds of evaluation outputs. By evaluating the model outputs on such a broad level rather than focusing only on key outputs, it allows getting a more complete picture of the corresponding simulation. The table of contents of the validation pdf gives a good overview about the breadth of model outputs that can be simulated with a REMIND standard simulation, even though the validation pdf only shows a subset of possible model outputs.
- Interactive scenario analysis ==================================
The automated model validation is a good tool for visually evaluating a broad range of model outputs. However, comparison between model runs, i.e. between different scenarios, is rather difficult and inconvenient if the model results are scattered across different large PDF files.
3.1. AppResults
To overcome this issue, we developed the interactive scenario analysis and evaluation tools appResults and appResultsLocal as part of the library shinyresults (https://github.com/pik-piam/shinyresults), which show evaluation plots for multiple scenarios including historical data and other projections based on an interactive selection of regions and variables. You can use this tool by running the following R command, which will automatically collect all runs and visualize them:
shinyresults::appResults()This command opens an interactive window, where you can select the simulations that you want to evaluate.
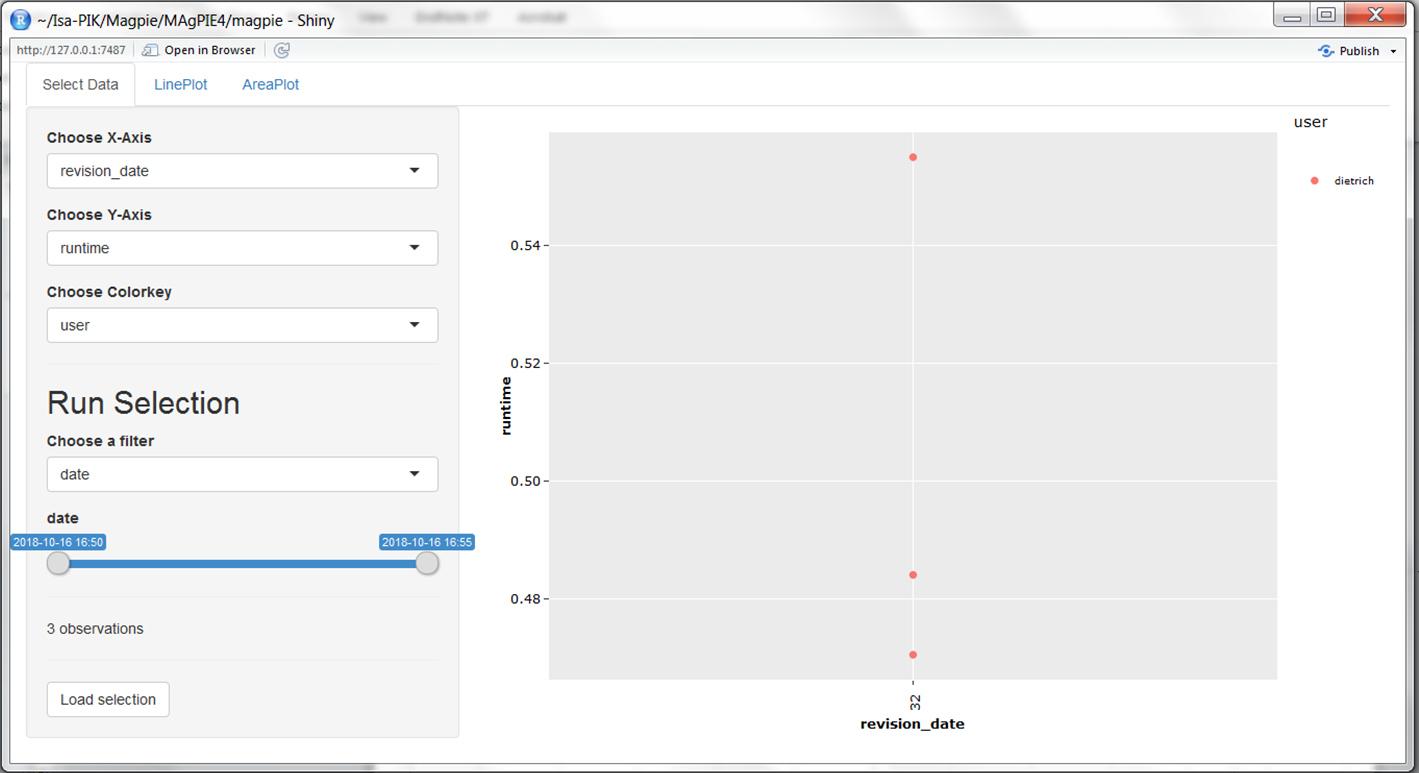
Interactive Results app
You can use filters to select a subset of all runs stored in the output folder of the model, for example by searching for runs that have been finished at a certain day or by searching for keywords in the title of the simulation runs:
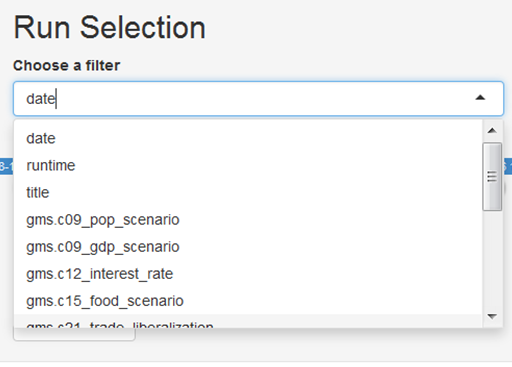
Run selection by using a filter
If you run the following command in the output folder of your local computer you get an interactive window containing the results of this output folder:
shinyresults::appResultsLocal()- Model-internal R-scripts for output analysis =================================================
4.1. Execution of model-internal output scripts via the REMIND configuration file
In the file config/default.cfg, it is possible to indicate which R-scripts are executed for output analysis after a model run is finished. Scripts evaluating single runs are stored in the folder scripts/output/[title-of-the-run]. In the default REMIND configuration, the scripts reporting, validation (see section 2.3), validationSummary (see section 2.3), rds_report (to be used in appResults; see section 3), and dashboard are selected via cfg$output:
cfg$output <- c("reporting","validation","rds_report","validationSummary","dashboard")4.2. Execution of model-internal output scripts in the command window
Output scripts that are included in the folders scripts/output/single and scripts/output/comparison can also be executed via command window. To do so, windows users can open a command line prompt in the REMIND model folder by using shift + right click and then selecting open command window here option.
In the command prompt, use the following command:
Rscript output.RYou are now asked to choose the output mode: 1: Output for single run 2: Comparison across runs
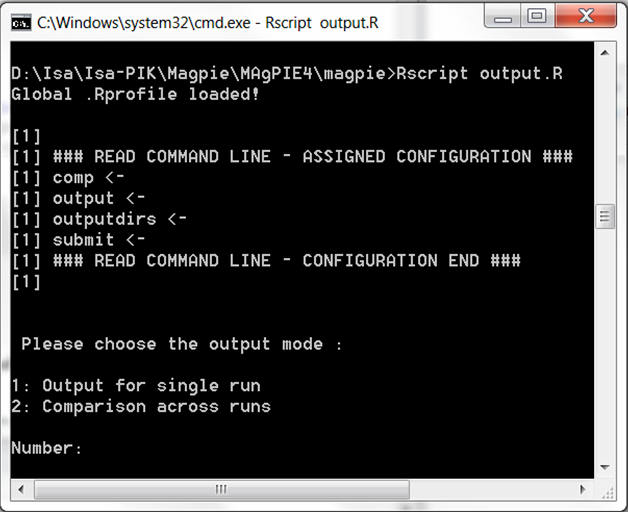
Executing output scripts via command window
In both cases, you can choose from the list of available model simulations, for which runs you want to conduct the model output analysis.In the next step, you can interactively indicate which model-internal output scripts you want to execute.
Now, the selected scripts are executed. After completion, the results are written in the respective folder of the simulation run (combination of model title name and the current date inside the output folder of the model).
- Analysis of outputs with the remind library ===============================================
If you want to go beyond visual output analysis and predefined output evaluation facilitated by scripts in the model folders scripts/output/single and scripts/output/comparison, you can use the functionality of the R package remind. This library contains a list of common functions for extracting outputs from the REMIND model which are also the basis for the generation of the automated validation pdf. For a quick overview on the functions which are included in the library, you can scan the folder remind/R.
For making yourself familiar with this library, you can open a R/RStudio session and set the REMIND model folder as working directory. This can be done by using the following command:
setwd("/path/to/your/remind/model/folder")Then, load the library and call the help pages:
library(remind)
?remind
You can click on the index and search for interesting functions. All functions used to generate the reporting start with "reporting*.R".
- Analysis of outputs with the quitte library ===============================================
You can read the .mif output into a dataframe, using the R library quitte, or into an array, using the R library magclass. Arrays are generally better for doing calculations, while dataframes are better for plotting. You will find out after a while which way works best for you. The quitte dataframes are probably better for output analysis because this is a lot about plotting. For reading in the .mif file as a dataframe, first load quitte by
library(quitte)You only need to load the libraries at the beginning of your R script or R session. Once you loaded a library, all the functions belonging to it are in your cache and you can always use them. In R Studio, you can type "quitte" into the search field of the help panel on the bottom right and go on quitte::quitte-package and index to find descriptions of the functions included in quitte. You can load the .mif data into a quitte dataframe by running the command
mifdata <- read.quitte(PathtoYourMifFile.mif)The data is now stored in the quitte object mifdata. Selecting it and hitting F2 will show you its content. Usually, you will want to filter for some regions, variables, periods that you are interested in. For example, like this:
df <- filter(mifdata,
   		region %in% c('EUR','LAM') &
			variable %in% c('SE|Electricity') &
			scenario %in% c('BAU') &
~period %in% c(2005,2030,2050)) - Analysis of outputs with the gdx library ===========================================
The gdx library (https://github.com/pik-piam/gdx) allows for directly accessing objects contained in the fulldata.gdx via the function readGDX. A pragmatic way to learn how to use this function for the extraction of interesting information from the fulldata.gdx is to open R-files of the remind library within Rstudio. Most of the remind functions make use of readGDX.
In the function reportPE.R of the remind library, we see several instances where readGDX is used, e.g.:
pe2se    <- readGDX(gdx,"pe2se")
Mport  <- readGDX(gdx,c("vm_Mport"),field="l",format="first_found")
demPE  <- readGDX(gdx,name=c("vm_demPe","v_pedem"),field="l",restore_zeros=FALSE,format="first_found")
It is possible to extract various GAMS objects like "sets", "equations", "parameters", "variables" and "aliases" with readGDX.
With the argument select=list(type="level"), you can select the levels of endogenous variables, with select=list(type="marginal") you can extract the marginal values of these variables.